Distruct v2.3
Table of Contents
1. Citations
2. User Guide
3. Commandline Usage
4. Register & Download
A python script for plotting admixture coefficients. This script is a modified version of the original distruct.py script from FastStructure (Raj et al, 2014). Admixture coefficients from any program (STRUCTURE, FastSTRUCTURE, ADMIXTURE, FRAPPE etc.) can be plotted using this cript. This version (2.3) provides following additional functionality, not present in the original version:
- Placement of populations in desired order
- Control cluster colors
- Control population label colors
How to Cite
-
Chhatre VE (2018) Distruct v2.3, A modified cluster membership plotting script. Available at http://distruct2.popgen.org
-
Raj A, Stephens M & Prichard JK (2014) fastSTRUCTURE: variational inference of population structure in large SNP data sets. Genetics, 197(2): 573-589.
Brief user guide
Input Files
-
.meanQfile i.e. cluster membership (admixutre) coefficients: Let’s assume that output file prefix isadmix. Your output files may have an extension depending upon what program you used. For example, STRUCTURE output files end in_f, ADMIXTURE output files end in.Qand fastStructure files end in.meanQ. You will need to rename these files to an extension ending in.meanQ. So our example files will be named as follows, assuming K=1 through K=5:admix.2.meanQ admix.3.meanQ admix.4.meanQ admix.5.meanQ -
popfilefile: this file could be named anything you want, just provide its complete name in the distruct commandline arguments. The number of rows here are equal to the number of individuals. But instead of listing individual names, it should list names of populations, for each individual, in the exact same order as in the.meanQfile. For example, assuming 3 populations, each with 3 individuals:POP1 POP1 POP1 ADMIX ADMIX ADMIX POP2 POP2 POP2 -
poporderfile: This file can also be named arbitrarily provided its actual name is provided as a commandline argument. The number of lines in this file are equal to number of populations in the data set, in the same order you wish to plot them. Let’s say we want to plotADMIXpopulation first,POP1in the middle andPOP2on the right. In our example data, this file is namedwest2eastADMIX POP1 POP2 -
popcolorsfile: In version 2.3, this file is mandatory. If it appears under a different name or is missing altogether, the plotting command will fail. The syntax of the file is similar topoporderfile above. One line per population, stating color you wish to use to print label for that population. Color names must be one of those available in Python. Important Note: Do not confuse this with the cluster colors themselves. Cluster colors are set within the main scriptdistruct2.3.pyonL33.blue purple darkgreen
Usage
- Here are our example input files
-rw-r--r--  1 vikram   5.7K admix.3.meanQ
-rw-r--r--  1 vikram   1.3K pop
-rw-r--r--  1 vikram    18B west2east
-rw-r--r--@ 1 vikram   6.8K distruct2.3.py
-rw-r--r--  1 vikram    22B popcolors
python distruct2.3.py -K 3
--input=admix
--output=admix_K3
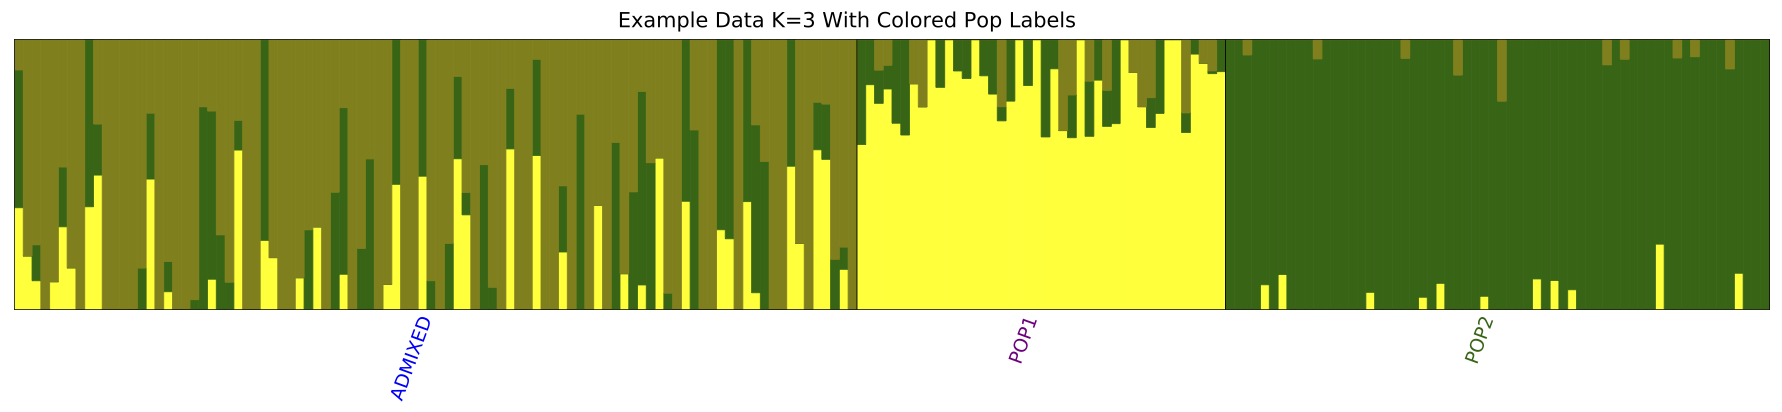
--title="Example Data K=3 With Colored Pop Labels"
--popfile=pop
--poporder=west2east
- Default output format is
.png. For other formats, provide file name extension explicitly. For pdf, use--output=admix_K3.pdf.
-rw-r--r-- 1 vikram 23K admix_K3.pdf